

Understanding ECG Traces – A Guide for BTEC Applied Science Students
- PM

- Jan 12
- 3 min read
Updated: Feb 19
When you study BTEC Applied Science Unit 1 - Principles and Applications of Biology I and II, one of the key topics in the cardiovascular system is the electrocardiogram, or ECG. This simple but powerful test records the electrical activity of the heart and is one of the most common diagnostic tools used in medicine today.
What Is an ECG?
Every time your heart beats, electrical impulses spread through the muscle tissue, making it contract in a coordinated way to pump blood. An ECG (electrocardiogram) detects these impulses using electrodes attached to the skin — usually on the chest, wrists and ankles.
These electrodes measure tiny voltage changes that occur when cardiac muscle cells depolarise and repolarise. The ECG machine amplifies these signals and displays them as a waveform on a screen or print-out.
The Heart’s Electrical Pathway
The pattern of the ECG trace reflects how electrical activity moves through the heart. The sequence is:
Sinoatrial (SA) node – the natural pacemaker; starts the impulse.
Atria contract as the impulse spreads across them.
The signal reaches the atrioventricular (AV) node, where it’s delayed slightly.
It then passes through the Bundle of His and Purkinje fibres, causing the ventricles to contract.
This sequence ensures the atria contract first, followed by the ventricles, allowing efficient blood flow.
The Main Parts of an ECG Trace
A normal ECG trace has three main labelled sections:
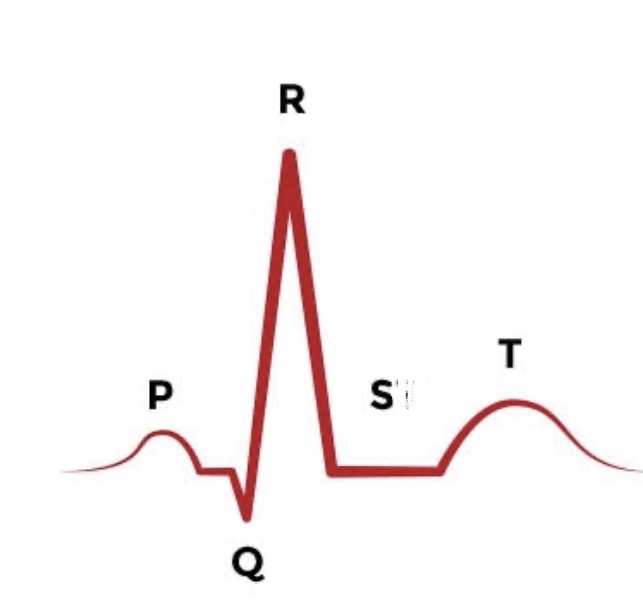
Wave/Segment | What It Shows | What’s Happening in the Heart |
P wave | Atrial depolarisation | The atria contract and push blood into the ventricles. |
QRS complex | Ventricular depolarisation | The ventricles contract and pump blood to the lungs and body. |
T wave | Ventricular repolarisation | The ventricles relax and prepare for the next beat. |
Each wave corresponds to a key part of the cardiac cycle. A healthy heart produces regular, evenly spaced waves — roughly 60–100 beats per minute in adults at rest.
Interpreting an ECG Trace
When analysing an ECG, scientists and healthcare professionals look at timing, shape and rhythm.
Heart rate: Count the number of QRS complexes in a set time.
Rhythm: Are the intervals between beats regular or irregular?
Wave size and shape: Abnormal wave height or length can indicate heart disease, damage or electrolyte imbalance.
Examples:
Tachycardia: More than 100 bpm — heart beating too fast.
Bradycardia: Fewer than 60 bpm — heart beating too slowly.
Arrhythmia: Irregular rhythm; may show missing or extra beats.
Myocardial infarction (heart attack): The ST segment may be elevated or depressed, showing damaged tissue.
Why ECGs Matter in Applied Science
For BTEC Applied Science students, ECG interpretation combines biology, physics, and health science:
Biology – cardiac muscle physiology and ion movement (depolarisation).
Physics – how electrical signals are detected and displayed.
Health – using scientific data to monitor and diagnose patients.
In assessments, you may be asked to label an ECG trace, identify abnormalities, or explain what each section represents. Understanding the link between electrical activity and muscle contraction will help you interpret these questions confidently.
Exam Tip
When describing an ECG trace:
“The P wave represents atrial contraction (depolarisation).The QRS complex shows ventricular contraction. The T wave shows ventricular recovery (repolarisation).”
Remember: one complete cycle = one heartbeat.
Real-World Application
ECGs are used in hospitals, GP surgeries and even smart watches to detect irregular heart rhythms early. For scientists and technicians, interpreting ECGs accurately can save lives — making it a perfect example of science applied to medicine.
✅ Key Takeaways
ECGs record the electrical activity of the heart.
Each wave represents part of the cardiac cycle.
Regular, correctly shaped waves show a healthy heart rhythm.
Abnormal traces indicate potential cardiovascular problems.
Understanding ECGs links theory and practice — exactly what BTEC Applied Science is all about.
Need extra support with BTEC Applied Science exam units.
We offer tailored 1:1 online lessons to help you:
✅ Understand tricky concepts like spirometer and Hess’s Law.
✅ Prepare for assignments and external assessments
✅ Build confidence in applied science
📩 Contact us today to book a free introductory session.


Comments